Surbub - survey and terrain modelling
The unique data entity system means data can be simply manipulated (plotted, deleted, searched, edited, rotated, renamed) by filtering from its user defined layers’ names and/or types (lots, roads, pipes etc) and/or label functions (area, point No, chainages, lot numbers etc). The standard program comes with 200,000 points with the option in the 10 w to increase up to 1,000,000 points.
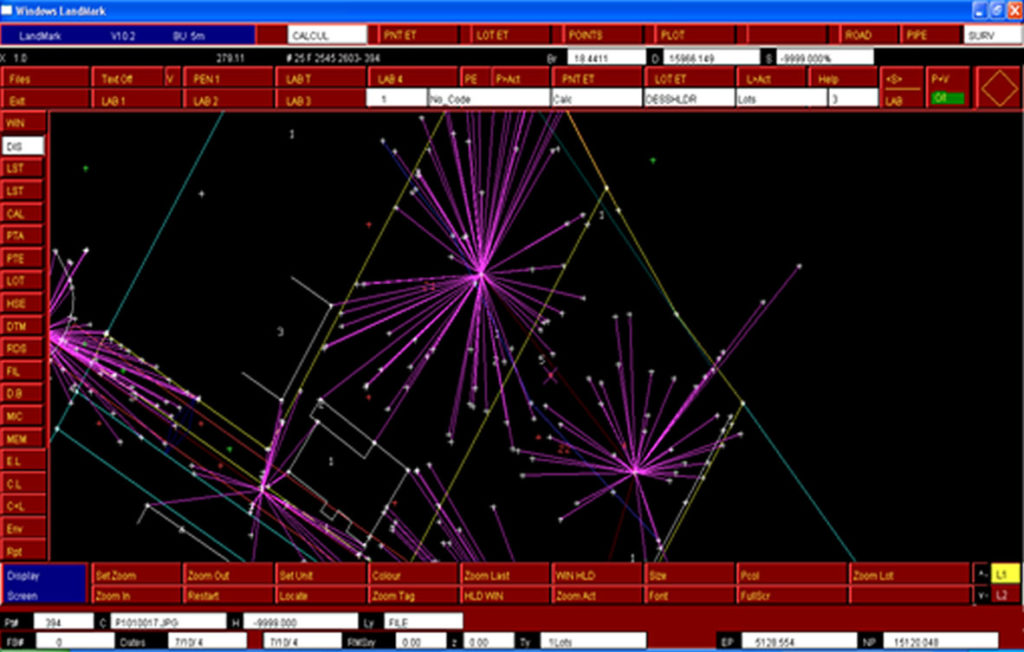
Interactive graphics allow the moving lot boundaries, house offsets, calculations on screen, radiations for lot roads and drainage setouts.
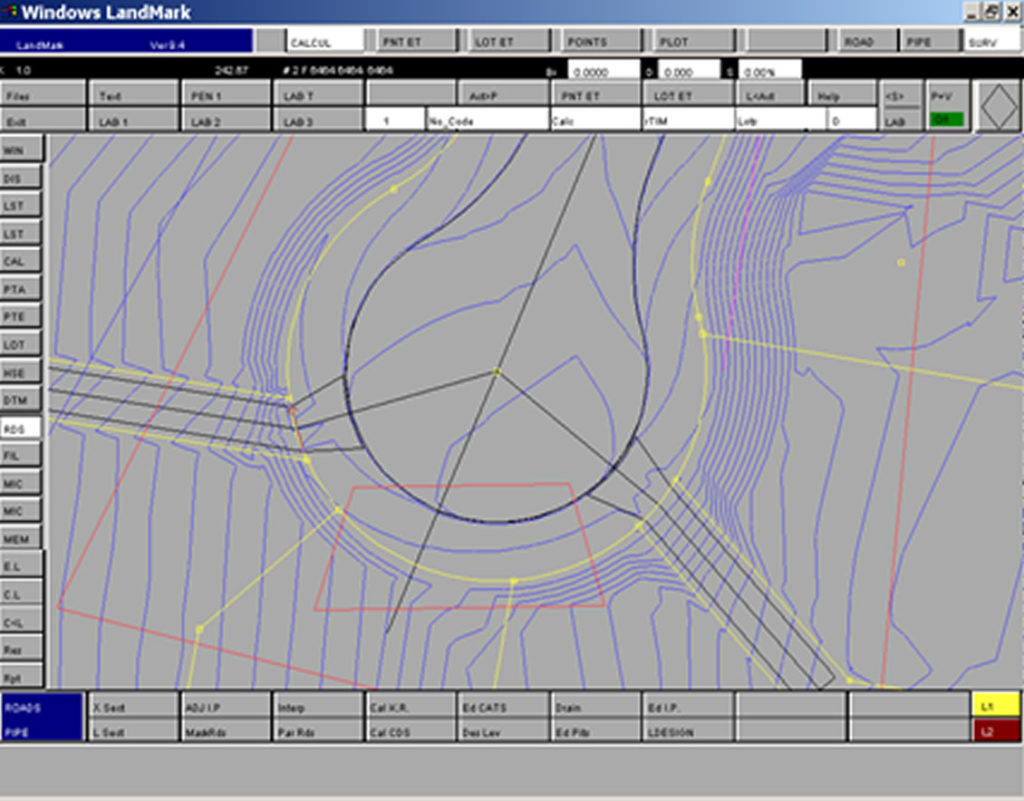
Automated calculations are paralleling, kerb returns, cul-de-sacs, road chainages, traverse radiations to lots or roads, co-ordinate adjustments (including rotations, shift and scaling).
Point information is automatic. As each point is clipped it will display both point (No, Code, Level, Layer, date created, date last edited and precision) and Lot (Layer Type No) information plus its relationship to the previous point clipped eg bearing distance.
Data input is by manual entry, data recorders (which use simple field coding to string points and assign user definable smart [stretch] symbols from the library and a variety of tree shapes [with trunks] to points), digitizing or importing most ASCII files. Field reductions points will maintain their field data No, HI,HP and Station created from for checking.
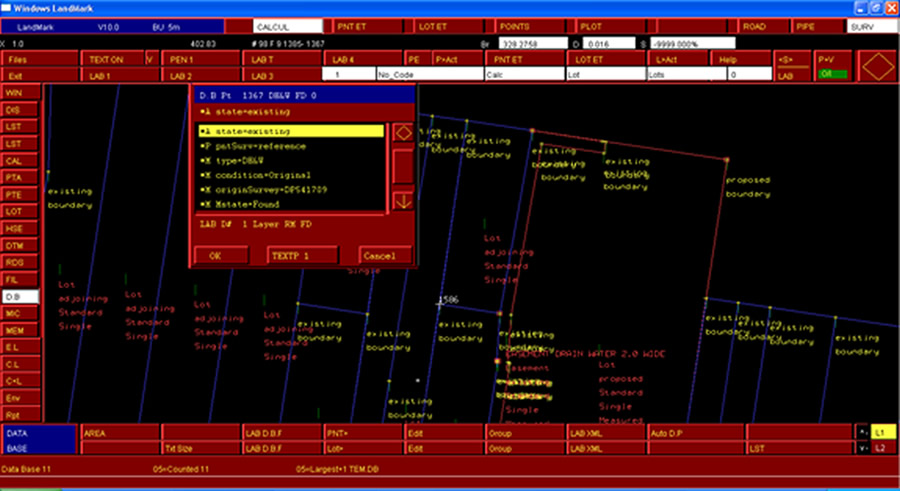
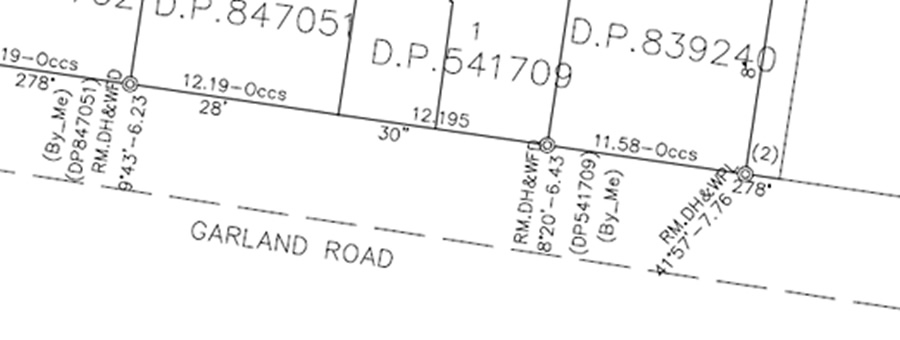
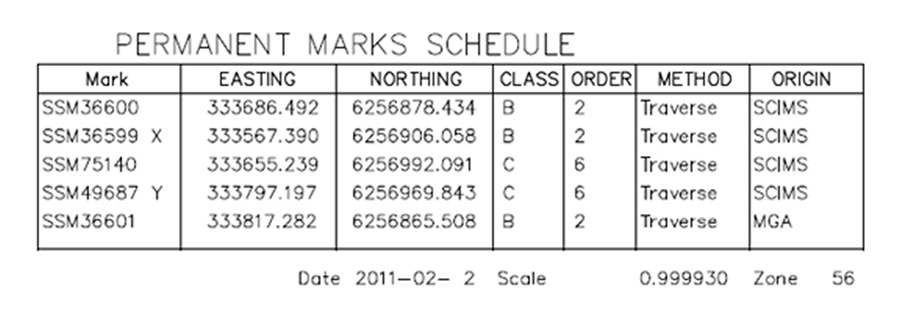
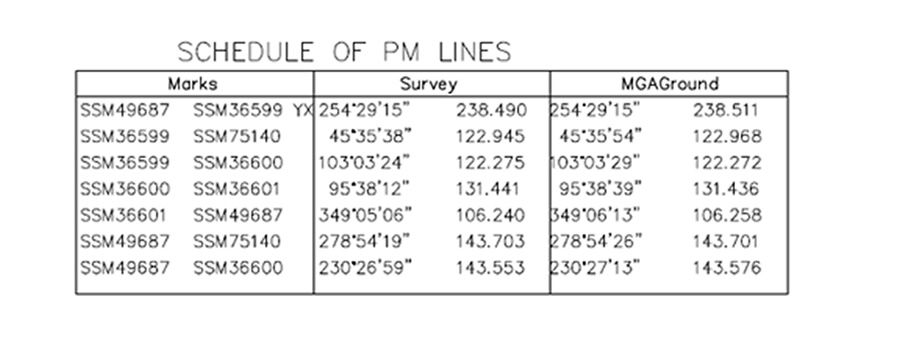
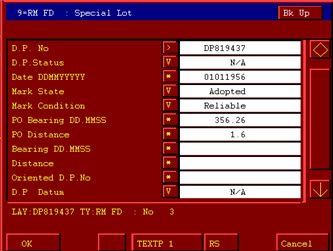
The special lots will include PM lots which have SCIM# with scale factors, MGA co-ordinates class order etc. These lots are linked together to create a table which will display a comparison of local and MGA bearing and distances using the scale factor to MGA co-ordinates to create ground co-ordinates. The reference marks lots will hold DP number which can be labelled. The other new lot is a DP lot which can you a bearing and distance comparison.
The Data Base information can be linked to points and lots by the filters or it can come in through the data recorder as an extension of the point code. This Data Base is split up into various fields eg street name, house number , note, type of tree.
The Lot and Points Filters have been refined even to incudes what switches are on/off eg display lots that are break lines ,areas on or distances on etc.
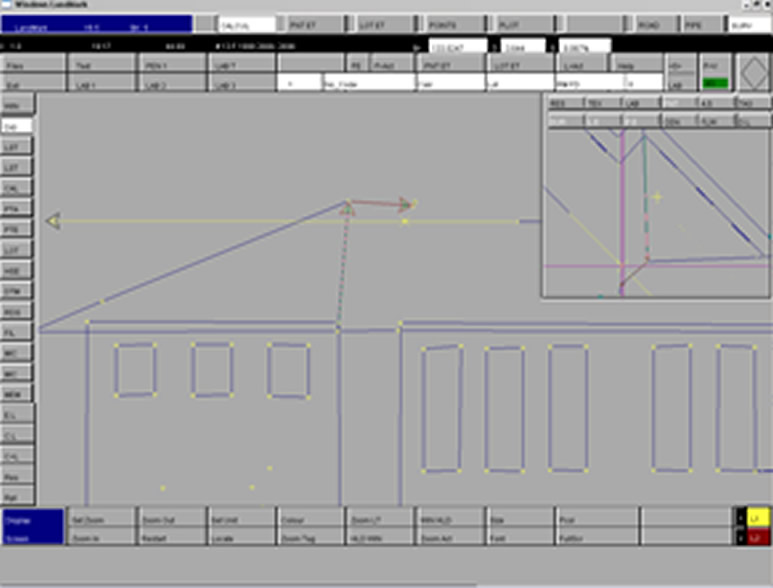
Survey calculations are simple, with the use of line memories and the ability to move lines (slide) or circles to other points. The number of stored lines for calculations has increase to L6 where L3 and L4 can be used to define a plane so you can intersect a line L1 with grade to a plane. The survey calculations can be done in either plan, elevation and in 3d. are displayed in the PV window.
RECO files are used to rename codes of raw data, assign data to layers and set entities switches for points and lots eg pens, line types.
Points can be automatically generated with levels around curves with an option to use road design kerb returns which can be inserted into the model.
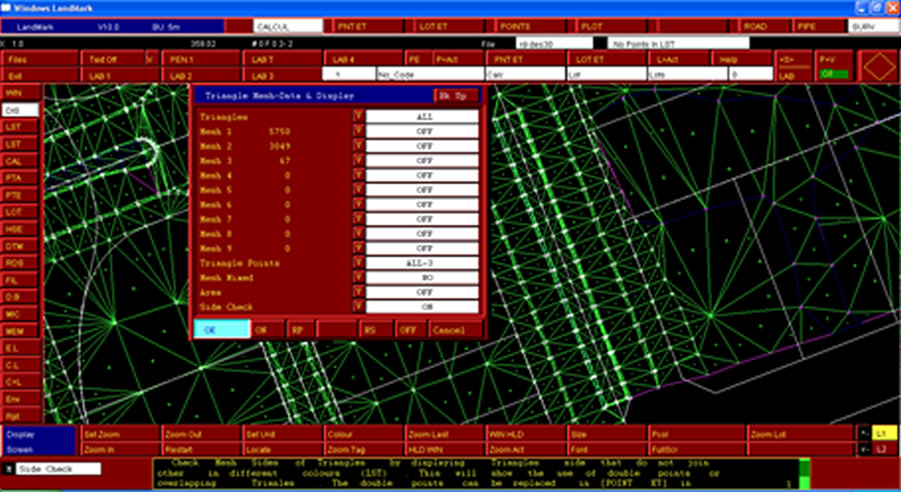
Triangles can be meshed from points in selected layers with options to hold existing meshes fixed. Models can be linked together and/or replicated from a section of the model of the original file. Batter from a string to the model or from another model.
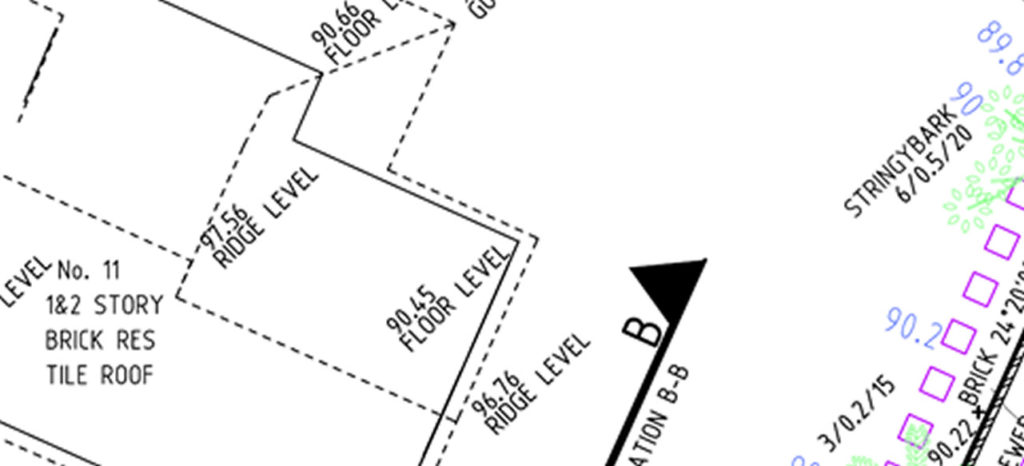
Automatic generation of offset lots displaying distances to a line and the ability to plot offsets in plan or in elevation.
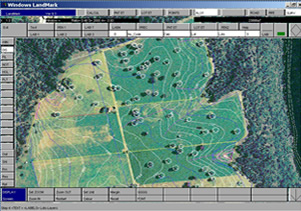
The contours change as the model is edited and adjusted by break lines. BREAK lines are used to adjust the model, keeping the integrity of data features.
Triangles are used to produce contours, calculate cut & fill volumes and areas to a plane or to another model with a option to use all the model or define an area by its mesh numbers eg stock piles , cut and fill areas are displayed in different colours.
A grid model can be generated from one surface, which can be compared to a second surface to create a grid file with height differences.
It is possible to design road or edit catchments in survey calculations.
Trial cross sections (with services) and long sections can be taken anywhere on the model and viewed before final extractions.
Extractions of surface levels from the model are taken at the fixed chainage and intervals with the option to pick up changes of grade and be sent to Road or Pipe to produce long sections and cross sections.
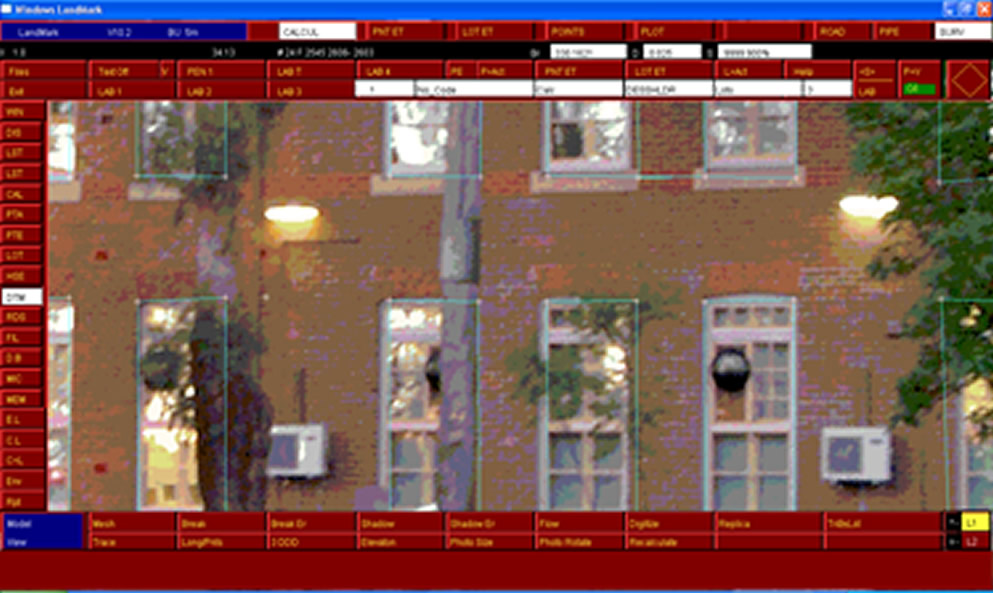
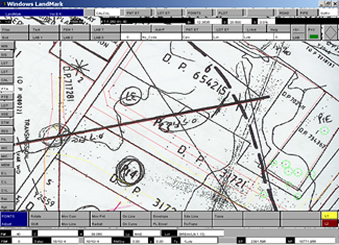
Photographs or scanned plans can be located under survey data and detail traced in plan or elevation. Also photos can be appended to points to display the view from that point.
On screen interactive graphics edit contours, create a model within a model with batter intersections, 3D perspective views from any viewpoint, various line types and codes. The Slope function displays the slopes over the model.
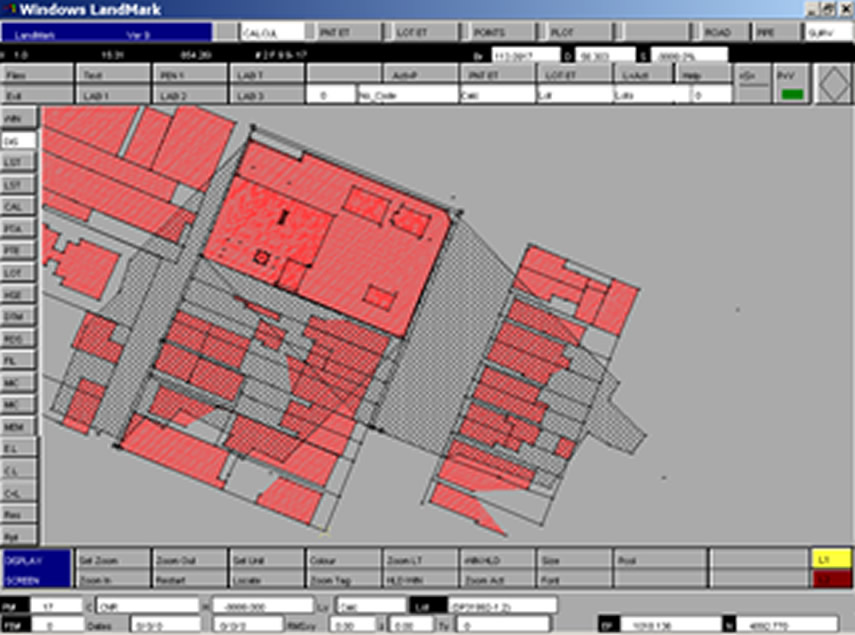
The Shade Projection displays the shadow from roofs onto the model or onto the walls in elevation. The user selects latitude, time and date. The White out Feature is used to kill the background drawing behind the new text. (only when output is direct to some ink-jet type plotters). Hatching patterns with a variety of styles can be easily applied to lots.
Flow function illustrates the flow of water from any point on the model.
Error reports can be generated on point and lot data (eg areas, segments, break lines).
Create Road design model uses the NS model as the base model to import design direct into the natural surface model to produce a finished model. With option to increase the intensity of sections by using the NS model as the base model to generate section.
The Plotting facility (or CAD files) will produce survey plans with automatic positioning and manipulating of survey dimensions, chainages, pit names from pipe, chords table, short lines, reference table, area, circles (and double) at lot corners, editing rotate levels, curved contours (and/ or plot a second design contour file), grids, hatching, various types of trees, title blocks, smart notes which fill out title blocks for each job, notes from other ASCII text files, etc. Dimensions are calculated when plotted. This makes plot window files flexible to change.
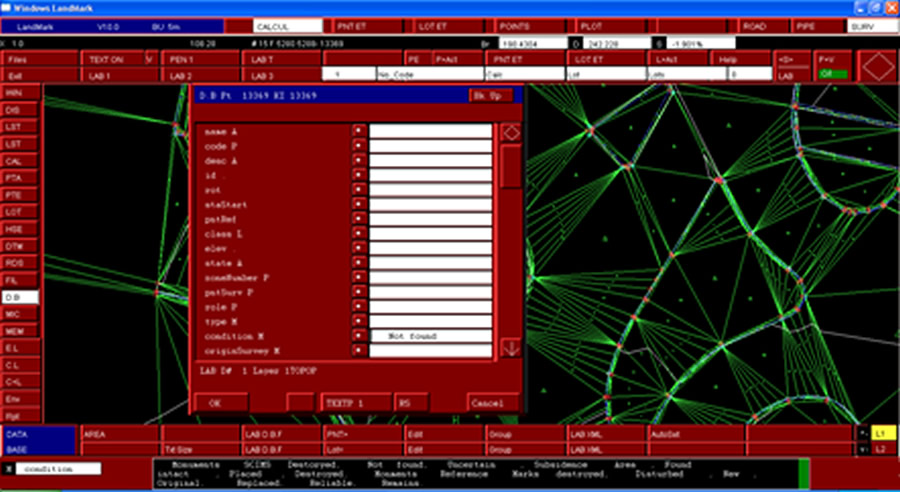
A new data base has been added to the software this data which can be viewed and edited on screen with its own Entities Switches and Pen allocations and linked to points and lots this contains the Land.xml elements and attributes. These Land.xml files can be can automatically generated from the landmark data with little or no editing. This data base can also be used for other applications within the software by storing up to 70 different fields (up to a total of 140 characters in total) of data to a point or lot even by the field work data capture eg name , description, class, state, role, type, condition, origin Survey, parcel Format, use Of Parcel , legal Area, note, building No, building Level No, D.P No x , Client Name x , Address , purpose, Tree Name , Photo Name, parcel Type, order, class, vertical Datum , currency Date, Pit Name, Over Land/Area Co , Pit Type x , owner, lot Entitlements, road Name , road name Suffix , road Name Type, road Type , address Type, flat Type, flat Number, floor Level Type, floor Level Number, title Type, title Type etc. This data base can be transfer survey data direct into Pipe Drainage program for calculations, eg catchments type , areas, with names, slopes, pit names, coefficients. This data can also be plotted as text on a plan by using the Points and Lot Entities switches with a new page added to land.xml.
There have been new lot types created or enhanced to make it run more smoothly into Land.xml for the LTO format:
- DP connection lot type 93. Display adjusted bearings, also to set X,Y of plan, compare azimuths between D.Ps and used to show connections when displaying the DP number of measurement and description of measurements.
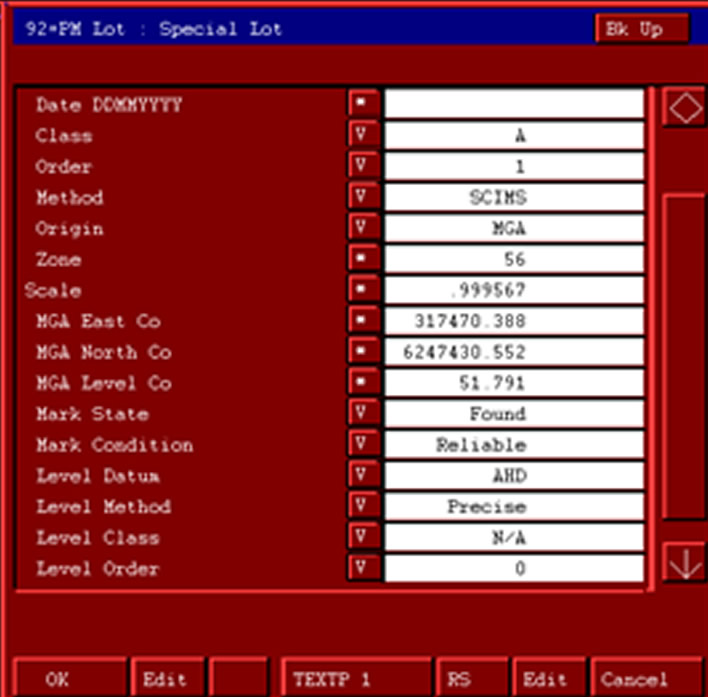
- Lot type 92 has been enhanced to hold control points data MGA x, y, z plus class, order ,method, condition, state , date, scale factor , zone etc which is used to plot the SCIMS table or sent to LXML. This data can be read in directly from a CSV file.
- Control lots type 78 is used to string PM lots type 92 points to display ground bearing/distance using MGA co-ordinates displaying XY , scale factor and survey bearing / distance using points.
- Reference lot Type 8,9 have been enhanced to hold state, condition, D.P number. Option to check Plan PO measurement and if differ by more that 0.015 for display “by me”.
- Connection lot Type 94 DP also to show connections and Land.xml and a description of measurements.
- Lot Profile type 72 is used with modelling face of walls meshing creating triangles , deleting , Break line in the vertical etc.
The generation of a secondary break line of chords around the existing arc with option to set lengths. These new break lines are used for 3d modelling or exporting where curves can not be used.
After introduction of secondary break lines as chords also Displaying Help files.
Help: added to every button on pop downs with option to select a text from help text and transfer into input box. eg condition of point options are found , placed , not found , click one.
New options have been added to the lot filters to find lots by its LOT ENTITIES switches. eg lots that are used in the data base. Lot names now use up to 4 ASCI characters as a lot name in normal data or 80 characters in the data base.
Survey option to mean a group of points eg GPS points.
Lot Entities. There is new switch to display a distance as an offset in X Y for set outs.
Triangles can loaded directly from a DXF file and Land.xml file,. There are more checking options to find stray triangles and the ACTIVE LOT can be used to set the limit of volume calculations.
There is an option to run default software after a plot file is created. Screen panning options stop refreshing once wheel is pressed.
New Checks on Triangles
That display missing or overlapping triangles in different colours